The Permanent Collection · The Science of Visualization
Bertin's Semiology of Graphics
Jacques Bertin, 1967
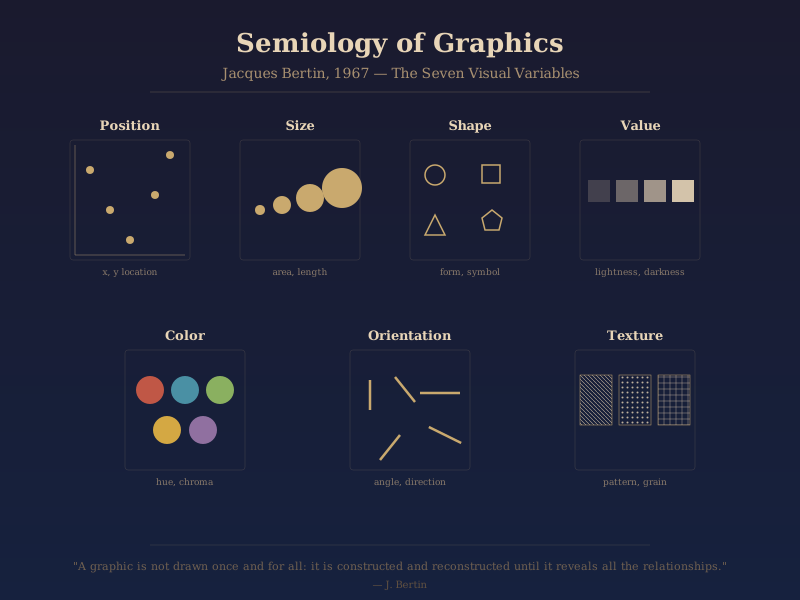
If there is one book that gave data visualization its theoretical backbone, it is Jacques Bertin's "Sémiologie Graphique," published in Paris in 1967. Bertin, a French cartographer and professor at the École des Hautes Études en Sciences Sociales, set out to answer a deceptively simple question: what are the fundamental visual building blocks available to anyone who wants to represent information on a flat surface? His answer was a systematic taxonomy of seven visual variables — position, size, shape, value (lightness), color (hue), orientation, and texture — along with a rigorous analysis of which variables are best suited for representing different types of data (quantitative, ordinal, or nominal). The book reads like a periodic table for graphics: once you understand the properties and limitations of each visual variable, you can construct effective visualizations from first principles rather than intuition alone. Despite its enormous influence on cartography and information design in the French-speaking world, the book was not translated into English until 1983, which delayed its impact in the English-speaking visualization community by nearly two decades. Today, Bertin's framework underpins the design logic of virtually every modern visualization tool — from D3.js to Tableau — even when the designers using those tools have never heard his name.
visual variables · theory · cartography · semiology · French