The Permanent Collection · The Pioneers of Modern Graphics
W.E.B. Du Bois's Data Portraits
W.E.B. Du Bois and students at Atlanta University, 1900
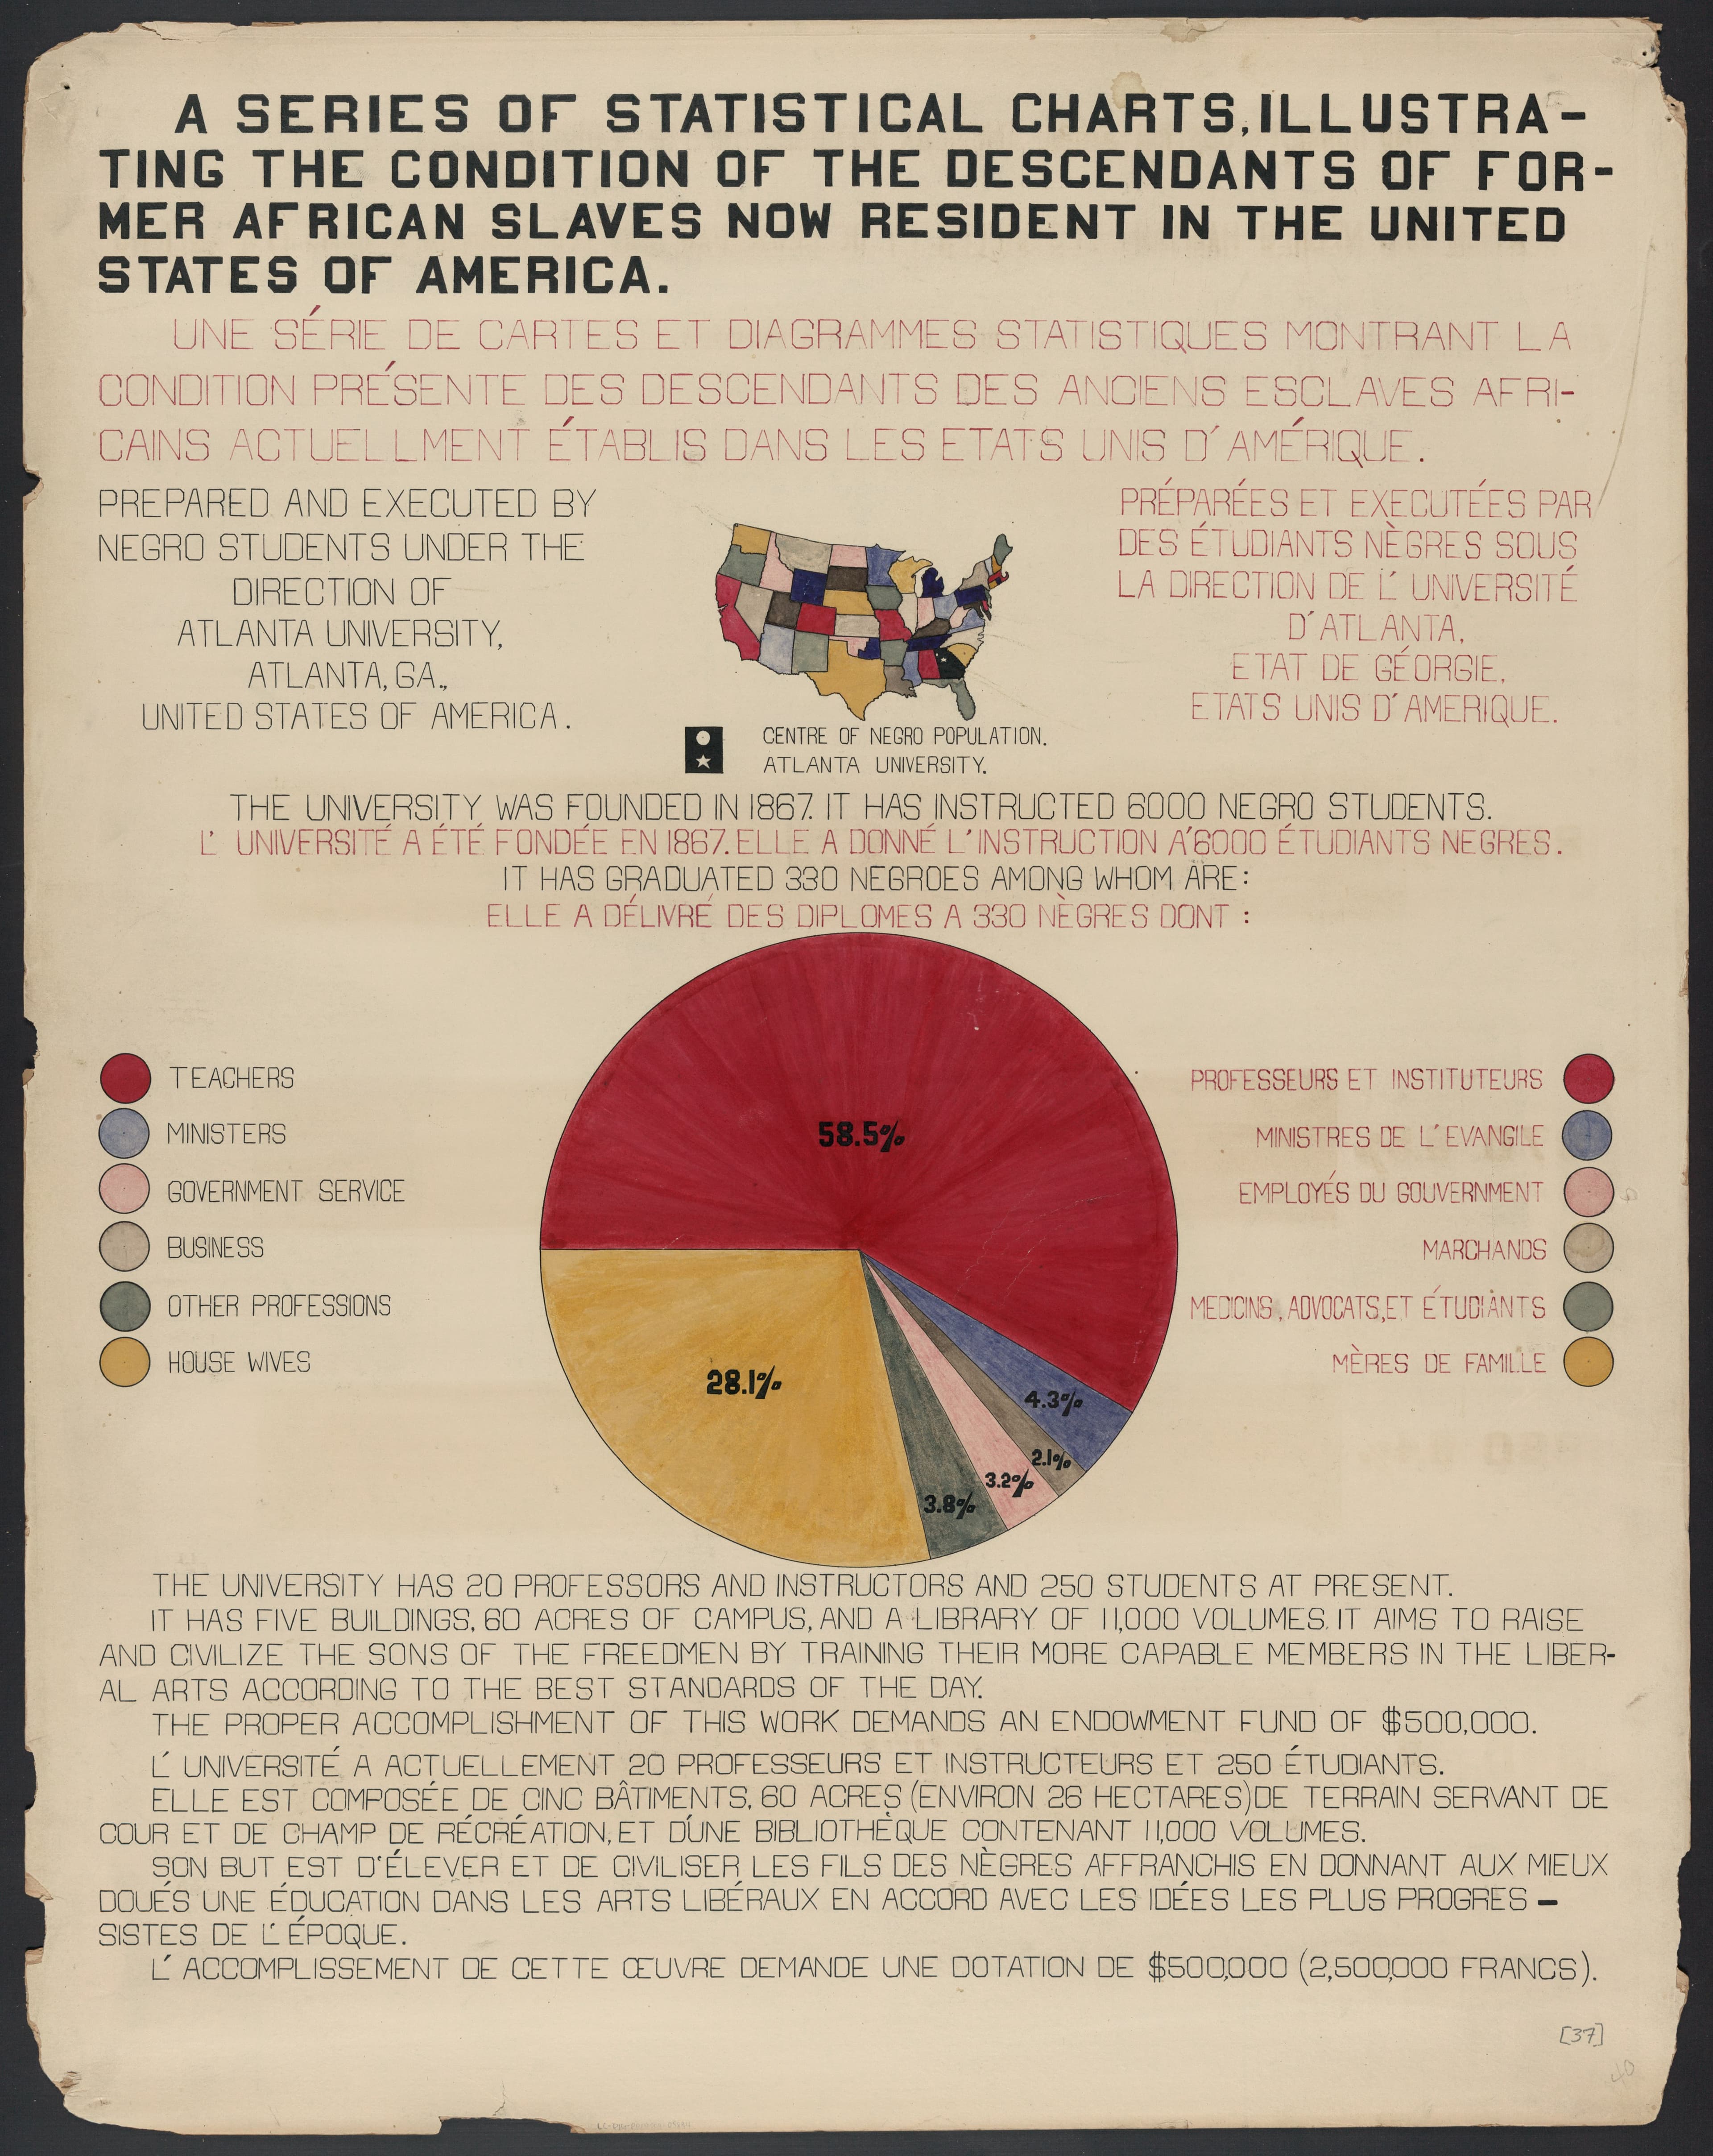
In 1900, sociologist W.E.B. Du Bois and a team of students at Atlanta University created a set of 63 hand-drawn data visualizations for the 'Exhibit of American Negroes' at the Paris Exposition Universelle — and in doing so produced one of the most striking and original bodies of data visualization work in history. The charts depicted the economic and social progress of Black Americans in the 35 years since emancipation, covering everything from property ownership and literacy rates to occupational distribution and population growth in Georgia. What makes these visualizations extraordinary isn't just the data — it's the design. Du Bois and his students used bold, saturated colors, dramatic spiraling bar charts, unconventional circular layouts, and a graphic sensibility that looks astonishingly modern, as if it leaped forward a full century in design thinking. The charts were photographed and archived, then largely forgotten for decades until data visualization researchers rediscovered them in the Library of Congress collection in the early 2010s. Since then, they've been celebrated in books, exhibitions, and academic papers for their artistic brilliance, their analytical rigor, and their powerful social message. They are a vivid reminder that data visualization has always been about more than numbers — it's about who gets to tell the story and how.
hand-drawn · Paris Exposition · racial equality · sociology · artistic