The Permanent Collection · The Science of Visualization
Isotype Picture Language
Otto Neurath and Gerd Arntz, 1936
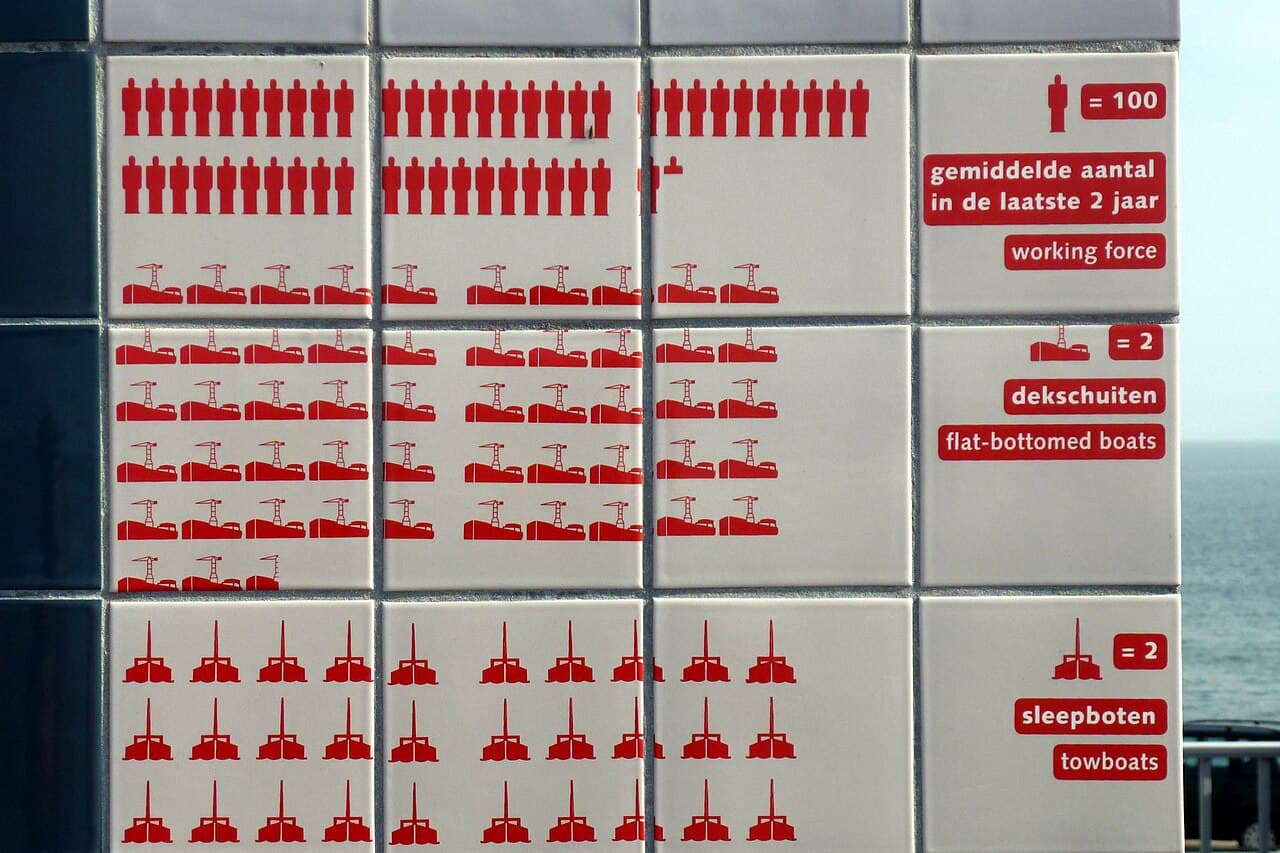
Before there were emoji, before there were app icons, before there were international airport pictograms — there was Isotype. Developed in Vienna in the 1920s and 1930s by the philosopher Otto Neurath and the graphic artist Gerd Arntz, the International System of Typographic Picture Education (Isotype) was a method of representing social, technological, and economic data through rows of identical, simplified pictorial symbols. Rather than using abstract bars or lines, Isotype charts showed quantities by repeating a small icon — one figure for every million people, one factory symbol for every hundred factories — making statistical information immediately comprehensible to anyone regardless of language or education. Arntz hand-cut over 4,000 different symbols in linocut, creating a visual vocabulary of astonishing range and consistency. Neurath published the system's principles in his 1936 book "International Picture Language," arguing passionately that visual education could bridge class and language barriers. The Nazis forced the team to flee Vienna, scattering Isotype practitioners to the Netherlands and England, but the system's influence proved unstoppable. Today, every time you see a row of person icons representing population, a pictograph chart in a newspaper, or a universal symbol on a restroom door, you are looking at a direct descendant of Neurath and Arntz's work.
pictorial statistics · icons · infographics · Vienna · visual education