The Permanent Collection · The Visualization Explosion
Observable: Notebook-Based Visualization
Mike Bostock and Jeff Heer, 2017
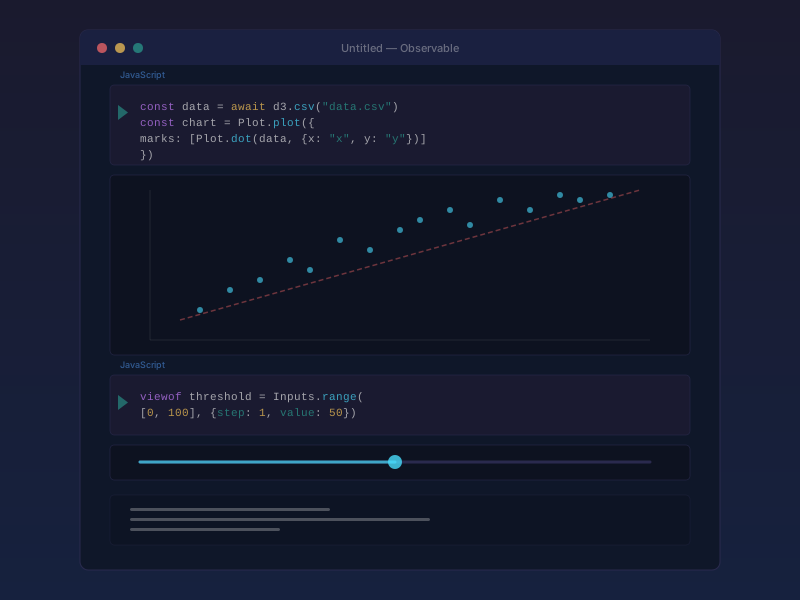
After D3.js conquered the web visualization world, its creator Mike Bostock turned his attention to a harder problem: making data visualization not just powerful, but accessible and collaborative. In 2017, Bostock and Jeff Heer — his former PhD advisor at Stanford, the same person who had created Prefuse a decade earlier — co-founded Observable, a platform built around reactive notebook-based data visualization. Observable notebooks looked like Jupyter notebooks but ran entirely in the browser, with a crucial twist: cells were reactive, meaning when you changed one value, everything downstream updated automatically, like a spreadsheet. This made it dramatically easier to prototype, iterate, and share interactive visualizations without setting up a local development environment. Bostock also introduced Observable Plot in 2021, a higher-level charting library built on top of D3 that made common chart types achievable in a few lines of code rather than a few hundred. The platform gained a devoted following among data journalists, researchers, and educators, hosting thousands of publicly shared notebooks that served as both finished visualizations and live tutorials. In 2024, Observable pivoted to focus on Observable Framework, a static-site generator for data apps, reflecting the broader industry shift toward integrated data storytelling. The Bostock-Heer partnership, stretching from Prefuse in 2005 to Observable in 2017, represents one of the most productive collaborations in the history of data visualization.
notebooks · reactive · collaborative · web platform · D3