The Permanent Collection · The Digital Turn
The Grammar of Graphics
Leland Wilkinson, 1999
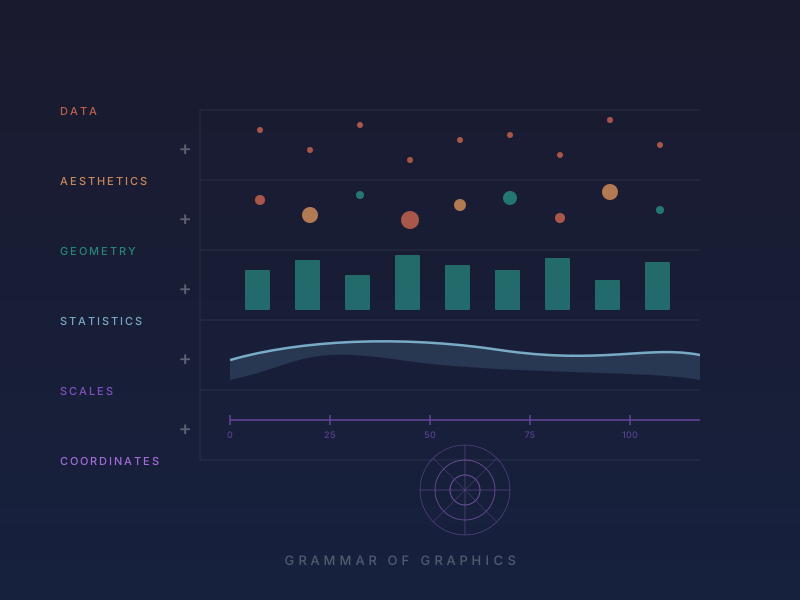
In 1999, statistician Leland Wilkinson published 'The Grammar of Graphics,' a book that did for data visualization what Noam Chomsky's generative grammar did for linguistics — it decomposed the seemingly infinite variety of statistical charts into a finite set of composable, formal components. Wilkinson's key insight was that every statistical graphic, no matter how complex, can be described as a combination of a few fundamental building blocks: data (the dataset being visualized), aesthetics (the mapping of data variables to visual properties like position, color, and size), geometry (the type of mark — points, lines, bars, areas), statistics (transformations like binning or smoothing), coordinates (Cartesian, polar, geographic), and facets (how to split data into subplots). By treating these as independent, stackable layers, Wilkinson created a formal system where you don't choose from a fixed menu of chart types — instead, you construct a visualization from first principles by specifying each layer. The book's impact was amplified enormously when Hadley Wickham, then a PhD student at Iowa State, used it as the theoretical foundation for ggplot2, an R package released in 2005 that became one of the most widely used visualization tools in the world. Through ggplot2, Wilkinson's ideas reached millions of data scientists, and the grammar-of-graphics approach has since been adopted by libraries in Python (plotnine, Altair), JavaScript (Vega-Lite, Observable Plot), and Julia. Wilkinson, who spent much of his career at SYSTAT and later at H2O.ai, proved that you don't need to memorize hundreds of chart types — you just need to understand the grammar.
grammar · theory · ggplot2 · composable · statistical graphics